- TechLead.ID
- Posts
- The Hidden Interest Rate: Quantifying the Cost of Tech Debt
The Hidden Interest Rate: Quantifying the Cost of Tech Debt
This article has been reviewed and grammar-checked with the help of AI to improve clarity and readability, without changing the original meaning or tone.
Every engineer knows what tech debt is, those quick fixes, messy corners, or “temporary” workarounds that somehow become permanent. But what most teams don’t realize is that tech debt doesn’t just sit there. It grows interest, silently. and that “interest” shows up as slower development, extra bugs, longer PRs, frustrated engineers, and that feeling that “everything just takes longer than it used to.”
If you’re not tracking that, you’re basically paying invisible interest in every sprint.
So, before we discus the “Interest” part, what does Technical Debt means ?

So it is a “quick fix”, or “temporary hack” that somehow stayed forever, or that one old service no one dares to touch because “it still works… right?” it is a trade-off between speed today and cost tomorrow. Sometimes it’s a smart, intentional decision. Other times it resulting bad implementation that get accumulated sprint by sprint. Having tech debt isn’t a sin, but ignoring it is. Because just like financial debt, the longer you ignore it, the more interest it accumulates.
Here is for non-tech people:
Technical debt is like taking a shortcut in software development. You get something working faster today, but you owe extra effort later to clean it up. It’s like “I need to fix it ASAP” or “This work temporarily, my stakeholder pushing us to release this feature tomorrow”

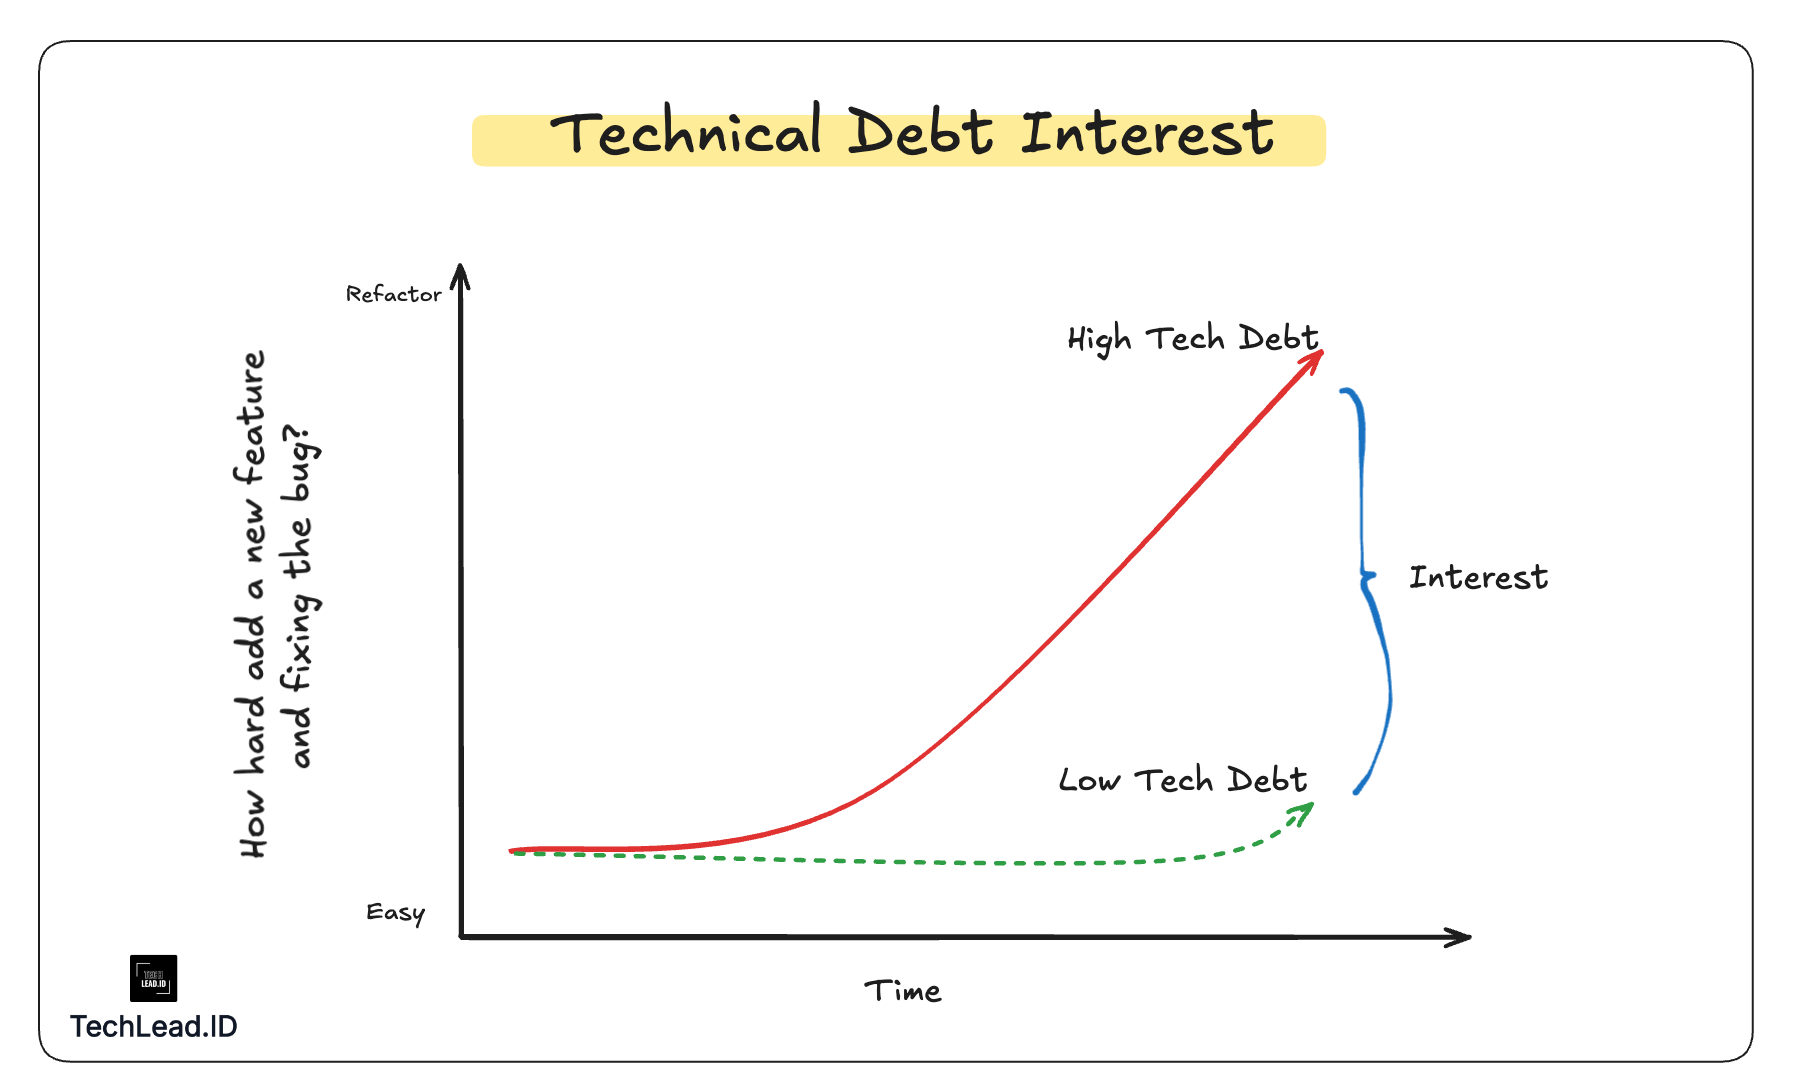
Technical Debt Interest Chart
In finance, interest is the cost of delaying repayment. Same as like in software development, it’s the cost of delaying clean-up. Most teams think tech debt only matters when something breaks. But the real danger isn’t the debt itself, it’s the interest you pay every single day. It affect how your team added a new feature in every sprint, as well as how do you fix every issue arise.
That interest shows up as:
Slower development cycles
Repeated bugs or regressions
Fragile systems that break in weird, unpredictable ways
If you’ve ever thought, “Why does everything take longer than it used to?”
That’s your tech debt interest rate quietly eating away at your velocity.
I’m still ongoing reading The Psychology of Money, but i will borrow a lens from finance terms that i took from that book;
Concept | Financial Equivalent | What It Means in Engineering |
|---|---|---|
Tech Debt | Liability | Short-term borrowing against engineering quality |
Refactoring | Debt Repayment | Paying back principal to lower future costs |
Maintenance of Work | OPEX | Regular cost to keep systems healthy |
Rewrites or Re-architecture | CAPEX | Major investment to reset or modernize foundation |
Interest Rate | Cost of Delay | Productivity, risk, and complexity that grow over time |
So, basically if you ignore your liabilities, the interest compounds and eventually, you pay more in OPEX just to keep the system afloat. You’ll keep upscaling your infrastructure capacity for something that you can fix on the code it self, you are adding feature with so many duplication code or the feature is so flaky because of bad abstraction. Let’s we deep dive into the formula below

Compound Interest
If you see the compound interest chart above, where A is the total amount (what you owe later), P is the principal (initial debt), and r is the interest rate.
Now imagine your P is the quick-and-dirty code you pushed to production last quarter.
Every sprint you delay fixing it, your interest (r) increases through slower PRs, more regressions, longer debug cycles, and team frustration. Eventually, the “total cost” (A) becomes far greater than the original shortcut you took.
Making the Invisible Visible
The first thing before we measure it, we should make all the tech debt visible for all team. Most teams feel the pain of tech debt long before they can point to where it lives. The key is to make that pain visible, traceable, and eventually measurable.
Here’s how to do it.
Tech Debt Registry
Start simple by maintaining a shared what we so called “Tech Debt Registry” or “Debt Backlog”. It can be as lightweight as a Google Sheet, Notion page, or Jira board.
Each entry should include:
Service / Module = where the debt lives
Description = what’s wrong (e.g., duplicated logic, outdated dependency, temporarily workarround)
Impact = how it slows the team or increases risk
Reporter = who find/report it
Priority / Severity = where you can define the priority
Treat it like a financial ledger. Every time you take a shortcut, log it. As a leader we should influence our engineer to log potential tech debt as soon as they encounter it. Visibility turns emotion (“this code is a mess”) into a concrete, trackable list.
I always told this to my engineer “Just because you found it doesn’t mean you own it.” Spotting a problem is the first step, not a life sentence.
Start the Discussion
Don’t make tech debt logging a separate ritual. Start the discussion whenever you are in the right forum such as weekly team sync or sprint planning. Review tech debt items just like you review the sprint tasks. Ask for clarity, assess impact, and decide together whether it’s time to fix this or prioritize something else. The earlier you surface it, the cheaper it is to fix. Before it catches fire.

Meme “This is Fine”
Over time, this builds an honest reflection of how much “interest” your system is accumulating.
Institutionalize the Tech Debt
You now have clear tech debt visibility, your team have an ambitious in every discussion. Whether it need to be executed or not, it’s depends on you.
Try this:
Allocate ~10–15% of sprint capacity to “interest repayment” (refactors, upgrades, tests).
Add “tech debt health” as a recurring slide in your Biweekly or regular team reviews.
Include debt reduction in OKRs (e.g., reduce MTTR by 20% through code cleanup).
Celebrate debt repayment the same way you celebrate new features.
When you normalize visibility, debt management stops being guilt-driven and starts being ROI-driven.
Quantify it
After you can make the “Invisible” into “Visible”, allocating ~10–15% of sprint capacity to tackle every tech debt. Now start quantifying the “interest” of your tech debt. You can use some the framework such as DORA or SPACE. I will cover a few here:
Cycle Time
Compare how long PRs take to merge now vs. six months ago.
If your average went from 2 days to 3, that’s a 50% slowdown, your interest rate on productivity.
Code Complexity & Churn
High churn + high complexity = volatile debt.
Low churn + high complexity = hidden risk (nobody touches it, but one day they will).
Use tools like SonarQube, CodeClimate, or internal metrics dashboards to track the hotspots. You also can integrate it into individual KPI.
Incident Frequency & MTTR
If incidents keep recurring in the same area and take longer to fix, that’s interest on operational risk. You’re burning OPEX every time something breaks where you paying for yesterday’s shortcuts.
It’s better you read these two article:
Strategic Cost Management
Your team’s performance is a reflection of your leadership. Management might acknowledge small wins, but what they truly measure is impact that can be quantified. They look at cost efficiency, delivery speed, and risk mitigation. They speak in numbers. They speak in money.
Frame your engineering decisions in terms of ROI, opportunity cost, and long-term value. Show how better DX reduces churn, how automation cuts OPEX, and how technical debt compounds like interest. Translate your engineering metrics into financial signals:
Technical Symptom | Business Cost | Goal |
|---|---|---|
+25% slower PR cycle | Productivity loss = higher OPEX | Low PR Cycle. Fast product delivery, faster customer feedback, faster MVP |
3 recurring incidents | Reliability risk = customer churn | Increasing MRR |
Legacy infra dependency | Wasteful OPEX (paying more to maintain old tech) | Infra cost optimization |
When you connect tech debt to financial outcomes, it stops being “engineering hygiene” and becomes a strategic cost-management discussion.
Managing the Interest, Not Eliminating the Debt
You can’t remove all the tech debt. Just like companies balance borrowing and cash flow, you need to manage which debt is worth keeping and which must be paid down.
Identify High-Interest Debt
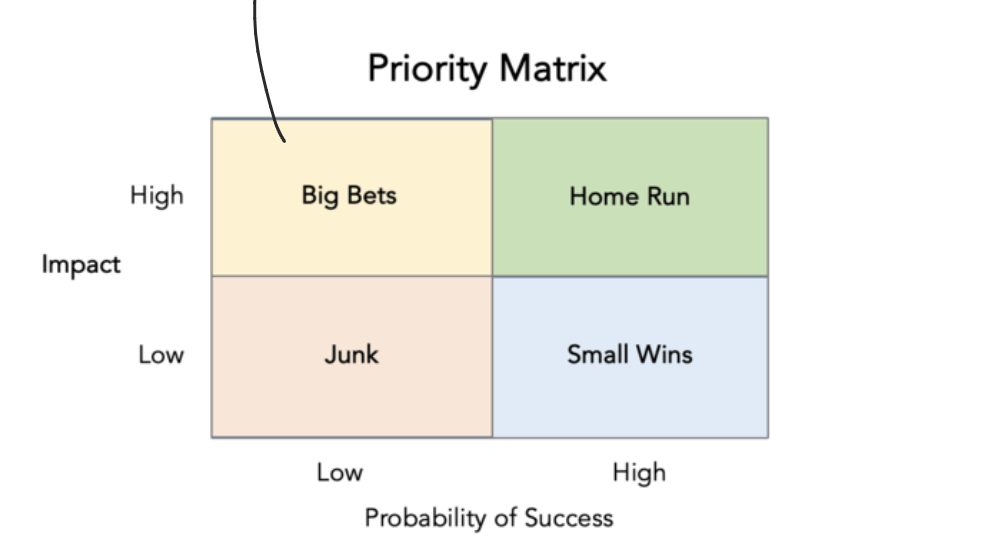
Focus on services that slow you down, break often, or block scalability. I always use this simple quadrant to prioritize the tech debt with my team

You can just replace the “Probability of Success” with “Code Churn rate”. If the impact is high but the churn rate is low, you are probably going into a big bets. You need to put significant investment refactoring that code.
If churn is low, even though the potential impact is high, the short-term ROI is low because:
You rarely touch that code, so refactoring yields little productivity gain.
Or nobody dare to touch that code ?
There’s minimal risk of compounding (interest) since the code doesn’t evolve.
The "interest payment" (ongoing pain) is small and predictable.

just a meme
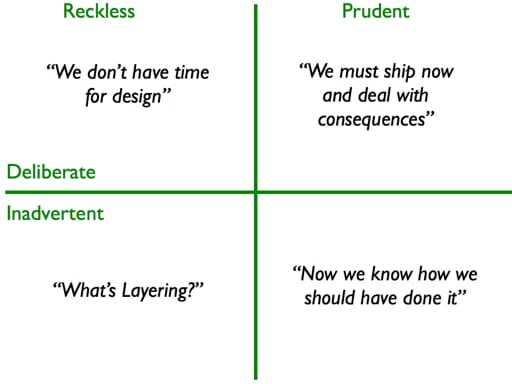
Or you can use quadrant from Martin Fowler here: Technical Debt Quadrant

Martin Fowler Technical Debt Quadrant
The Real Payoff: Healthier OPEX and Predictable Delivery
When teams start managing tech debt like their financial portfolio, you’ll notice two things:
Predictable delivery = Better planning/estimating, on-time release
Lower long-term OPEX = fewer firefights, cleaner deploys, faster onboarding.
Your codebase becomes an appreciating asset, not a liability.
Final Thoughts
Tech debt isn’t evil. It’s a financial instrument, a way to borrow time now and pay it back later. The problem starts, when you stop tracking the interest. You can’t remove all tech debt, nor should you. If you measure how much that interest is costing you in time, morale, or operational budget, you’ll make smarter trade-offs between speed and sustainability.
Because at the end of the day, managing tech debt is just engineering finance:
balancing CAPEX and OPEX in your codebase to keep the business running efficiently and the team sane.
In the middle of difficulty lies opportunity
Reply